Introduction
Suppose you are a developer who intends to incorporate past blockchain data into your application. Blockchain networks store all transactions that have ever occurred on the network, creating a massive amount of data. Accessing and querying this data can be a challenge, as it requires specialized tools. That's where indexers such as Footprint Analytics come in.
The blockchain does not store entities in a direct and explicit form. For instance, if you desire to obtain statistics on transactions involving Non-Fungible Tokens (NFTs), you cannot simply query the blockchain to retrieve such data. Rather, you only have access to the raw data available, such as transactions, their logs, and traces (in the case of EVM). This data can be quite extensive and complex, requiring significant processing and analysis to derive the desired information. And although raw data is a valuable resource, it may not be enough for an easy infrastructure development or analysis.
Example
Let us take a closer look at the data. One of the primary challenges in the blockchain ecosystem is the heterogeneity of different chains, each with their distinct features, data structures, and implementations. For example, Ethereum or any EVM-compatible chain, has the ERC-721 standard for NFTs, while Polkadot has different standards.
Despite this diversity, an efficient instrument should enable the effortless merging of the same entities from various chains into a unified entity. This entity could be stored in a table named nft_transactions similar to how traditional databases function. This not only streamlines the analysis and the infrastructure development processes, but it also offers a comprehensive view of the NFT market across multiple chains. That's exactly what Footprint does - we call those higher-level entities the abstractions. To learn more about our data model, check out our data overview documentation.
Step-by-step guide
Abstractions simplify the process of finding what users are searching for. But what about integrating your projects? Footprint simplifies this process by breaking it down into four easy steps:
- You build a visualization on our web application to validate the correctness of the resulting charts.
- You copy the SQL code of the corresponding graph, which is a query language that Footprint's database understands.
- You insert this SQL code into our API, and receive the same information in a computer-readable format called JSON, rather than as a visualization.
- You use the received data to improve your application.
Next, we will provide a detailed, step-by-step guide on how to achieve this using the Footprint web application and the SQL API, based on the user interface.
Step 1. Create a chart in the web-application
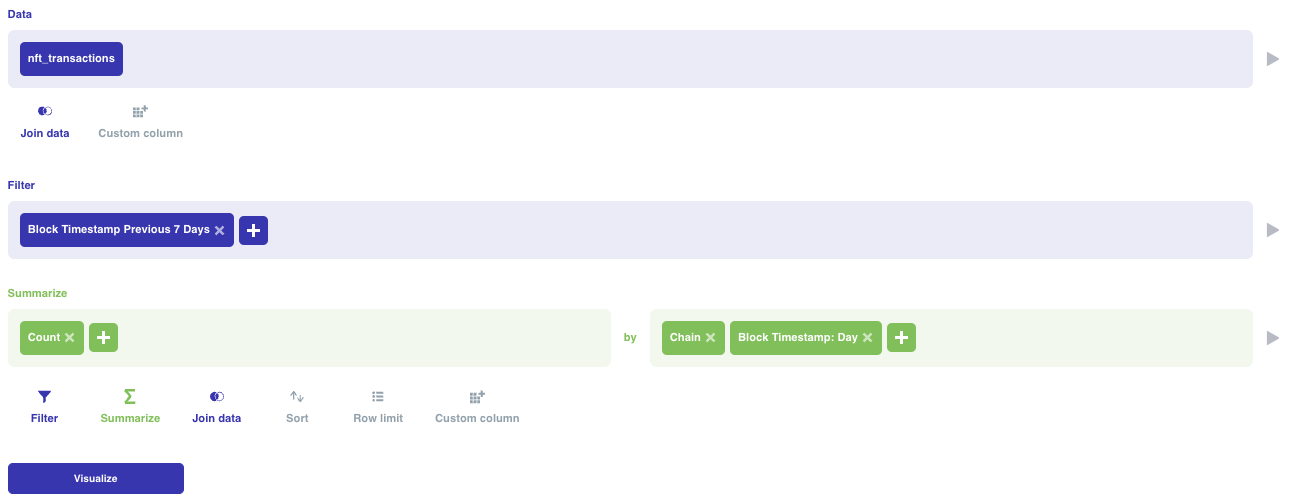
Here provides a comprehensive guide on creating charts without the need for coding. By utilizing this guide, you will be able to construct a chart that tabulates the quantity of NFT transactions within the previous seven days, categorized by their corresponding blockchains and dates. The query in the constructor will appear as following:

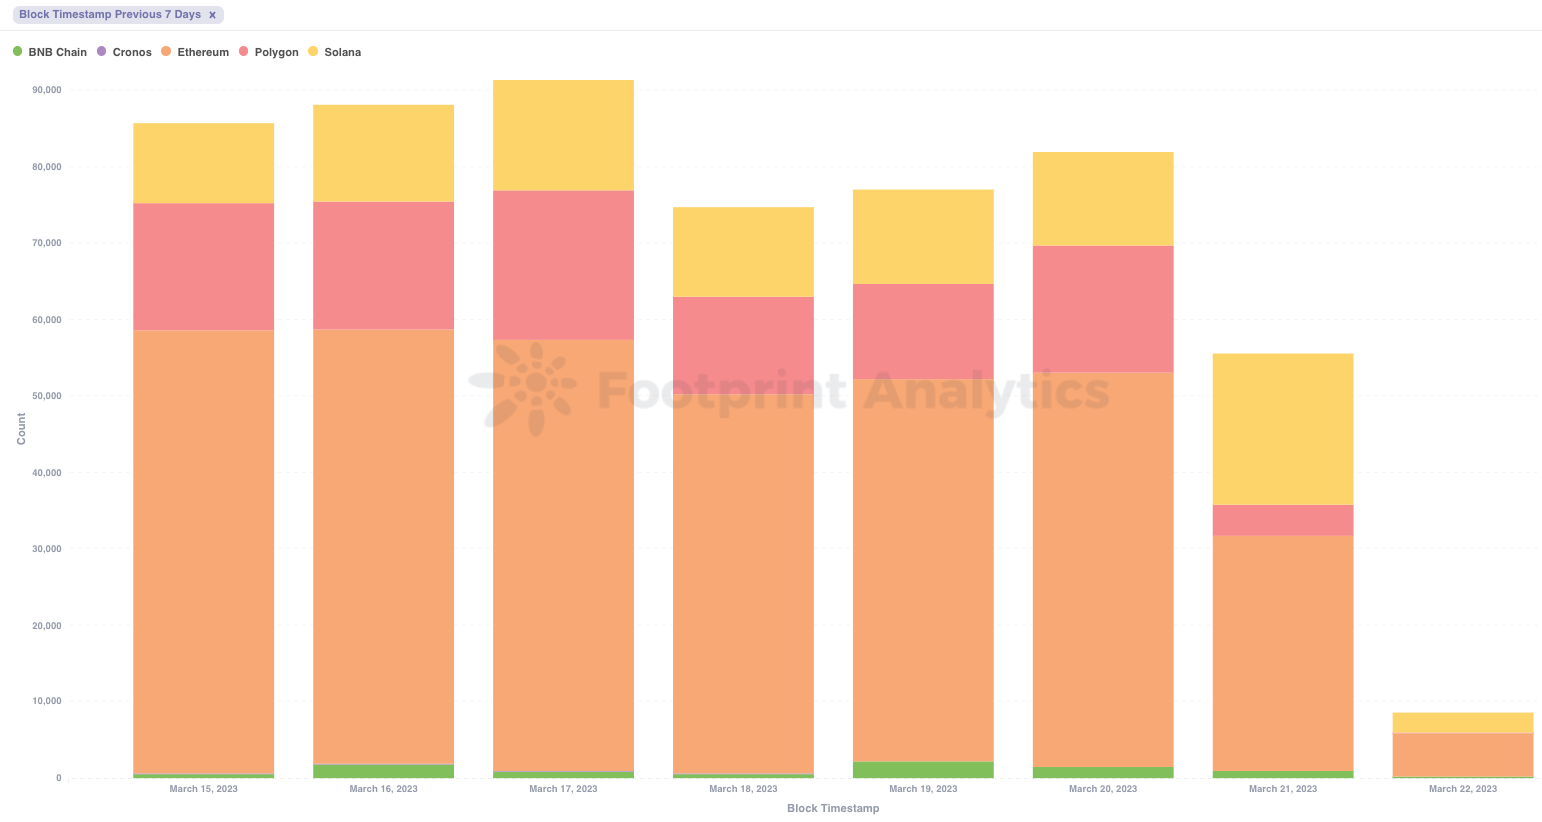
After applying the visualization to the chart, it will have the appearance shown in the following figure:

By examining the chart in a user-friendly visual format (as illustrated above in the form of a bar chart), you can verify its accuracy. After ensuring that the resulting graph is correct, you can move on to the subsequent step.
Step 2. Get a query SQL code
Every graph is a visual representation laid over the data displayed in a table format. Therefore, each graph will have its individual SQL code. To acquire the code for your chart, please refer to this chapter in our documentation.
By adhering to the instructions, we can acquire the SQL code, which appears as follows:
SELECT
  chain,
  date(block_timestamp) as block_timestamp,
  count(*) AS count
FROM
  nft_transactions
WHERE (
  block_timestamp >= date(date_add('day', -7, now())) AND
  block_timestamp < date(date_add('day', 1, now()))
)
GROUP BY
  chain,
  block_timestamp
ORDER BY
  chain ASC,
  block_timestamp ASC
Step 3. Query SQL API
After obtaining the SQL code, you can employ it within the SQL API. Once you submit a legitimate request, you will receive the corresponding objects in a JSON format. For instance, if you send the aforementioned request, the ensuing response will be in the form of the following JSON:
{
  "message": "success",
  "code": 0,
  "data": [
    {
      "chain": "Solana",
      "block_timestamp": "2023-03-17",
      "count": 14458
    },
    {
      "chain": "Cronos",
      "block_timestamp": "2023-03-17",
      "count": 28
    },
    {
      "chain": "Solana",
      "block_timestamp": "2023-03-20",
      "count": 12204
    },
    {
      "chain": "Ethereum",
      "block_timestamp": "2023-03-18",
      "count": 49664
    },
    {
      "chain": "Polygon",
      "block_timestamp": "2023-03-21",
      "count": 4074
    },
    {
      "chain": "Polygon",
      "block_timestamp": "2023-03-19",
      "count": 12445
    },
    {
      "chain": "BNB Chain",
      "block_timestamp": "2023-03-17",
      "count": 865
    },
    {
      "chain": "Solana",
      "block_timestamp": "2023-03-16",
      "count": 12733
    },
    {
      "chain": "Cronos",
      "block_timestamp": "2023-03-18",
      "count": 39
    },
    {
      "chain": "Solana",
      "block_timestamp": "2023-03-15",
      "count": 10447
    },
    {
      "chain": "BNB Chain",
      "block_timestamp": "2023-03-15",
      "count": 484
    },
    {
      "chain": "Polygon",
      "block_timestamp": "2023-03-16",
      "count": 16717
    },
    {
      "chain": "Polygon",
      "block_timestamp": "2023-03-15",
      "count": 16639
    },
    {
      "chain": "BNB Chain",
      "block_timestamp": "2023-03-16",
      "count": 1744
    },
    {
      "chain": "BNB Chain",
      "block_timestamp": "2023-03-21",
      "count": 932
    },
    {
      "chain": "Polygon",
      "block_timestamp": "2023-03-22",
      "count": 132
    },
    {
      "chain": "Solana",
      "block_timestamp": "2023-03-21",
      "count": 19721
    },
    {
      "chain": "BNB Chain",
      "block_timestamp": "2023-03-20",
      "count": 1414
    },
    {
      "chain": "Ethereum",
      "block_timestamp": "2023-03-21",
      "count": 30806
    },
    {
      "chain": "Cronos",
      "block_timestamp": "2023-03-21",
      "count": 9
    },
    {
      "chain": "BNB Chain",
      "block_timestamp": "2023-03-18",
      "count": 530
    },
    {
      "chain": "Ethereum",
      "block_timestamp": "2023-03-17",
      "count": 56450
    },
    {
      "chain": "Solana",
      "block_timestamp": "2023-03-22",
      "count": 3680
    },
    {
      "chain": "Solana",
      "block_timestamp": "2023-03-18",
      "count": 11676
    },
    {
      "chain": "Cronos",
      "block_timestamp": "2023-03-16",
      "count": 167
    },
    {
      "chain": "Ethereum",
      "block_timestamp": "2023-03-19",
      "count": 50032
    },
    {
      "chain": "Cronos",
      "block_timestamp": "2023-03-15",
      "count": 137
    },
    {
      "chain": "BNB Chain",
      "block_timestamp": "2023-03-19",
      "count": 2152
    },
    {
      "chain": "Ethereum",
      "block_timestamp": "2023-03-15",
      "count": 58008
    },
    {
      "chain": "Polygon",
      "block_timestamp": "2023-03-18",
      "count": 12794
    },
    {
      "chain": "Ethereum",
      "block_timestamp": "2023-03-22",
      "count": 6774
    },
    {
      "chain": "Solana",
      "block_timestamp": "2023-03-19",
      "count": 12361
    },
    {
      "chain": "Polygon",
      "block_timestamp": "2023-03-20",
      "count": 16694
    },
    {
      "chain": "Polygon",
      "block_timestamp": "2023-03-17",
      "count": 19576
    },
    {
      "chain": "Ethereum",
      "block_timestamp": "2023-03-20",
      "count": 51515
    },
    {
      "chain": "BNB Chain",
      "block_timestamp": "2023-03-22",
      "count": 334
    },
    {
      "chain": "Ethereum",
      "block_timestamp": "2023-03-16",
      "count": 56821
    },
    {
      "chain": "Cronos",
      "block_timestamp": "2023-03-20",
      "count": 80
    }
  ]
}
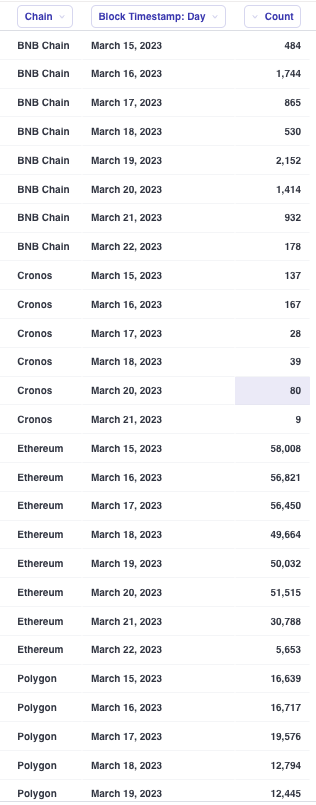
It can be observed that an array comprising objects with identical sub-objects (i.e., chain, block_timestamp, count) has been retrieved. If you represent the chart obtained earlier on step 2. in a tabular format, the same information can be obtained, albeit in the form of a table:

Feel free to utilize the resultant object in any manner you prefer for your project.
