
Get Started
Welcome to the ecosystem of our products designed to help you gain insights and maximize your marketing strategies. Our ecosystem consists of three products: Growth Analytics, Analytics APP, and Data API.
Firstly, Growth Analytics offers a comprehensive solution to collect and analyze data from various Web2 and Web3 sources. With its powerful analytics capabilities, you can identify trends, monitor KPIs, and get a competitive edge in your marketing strategies.
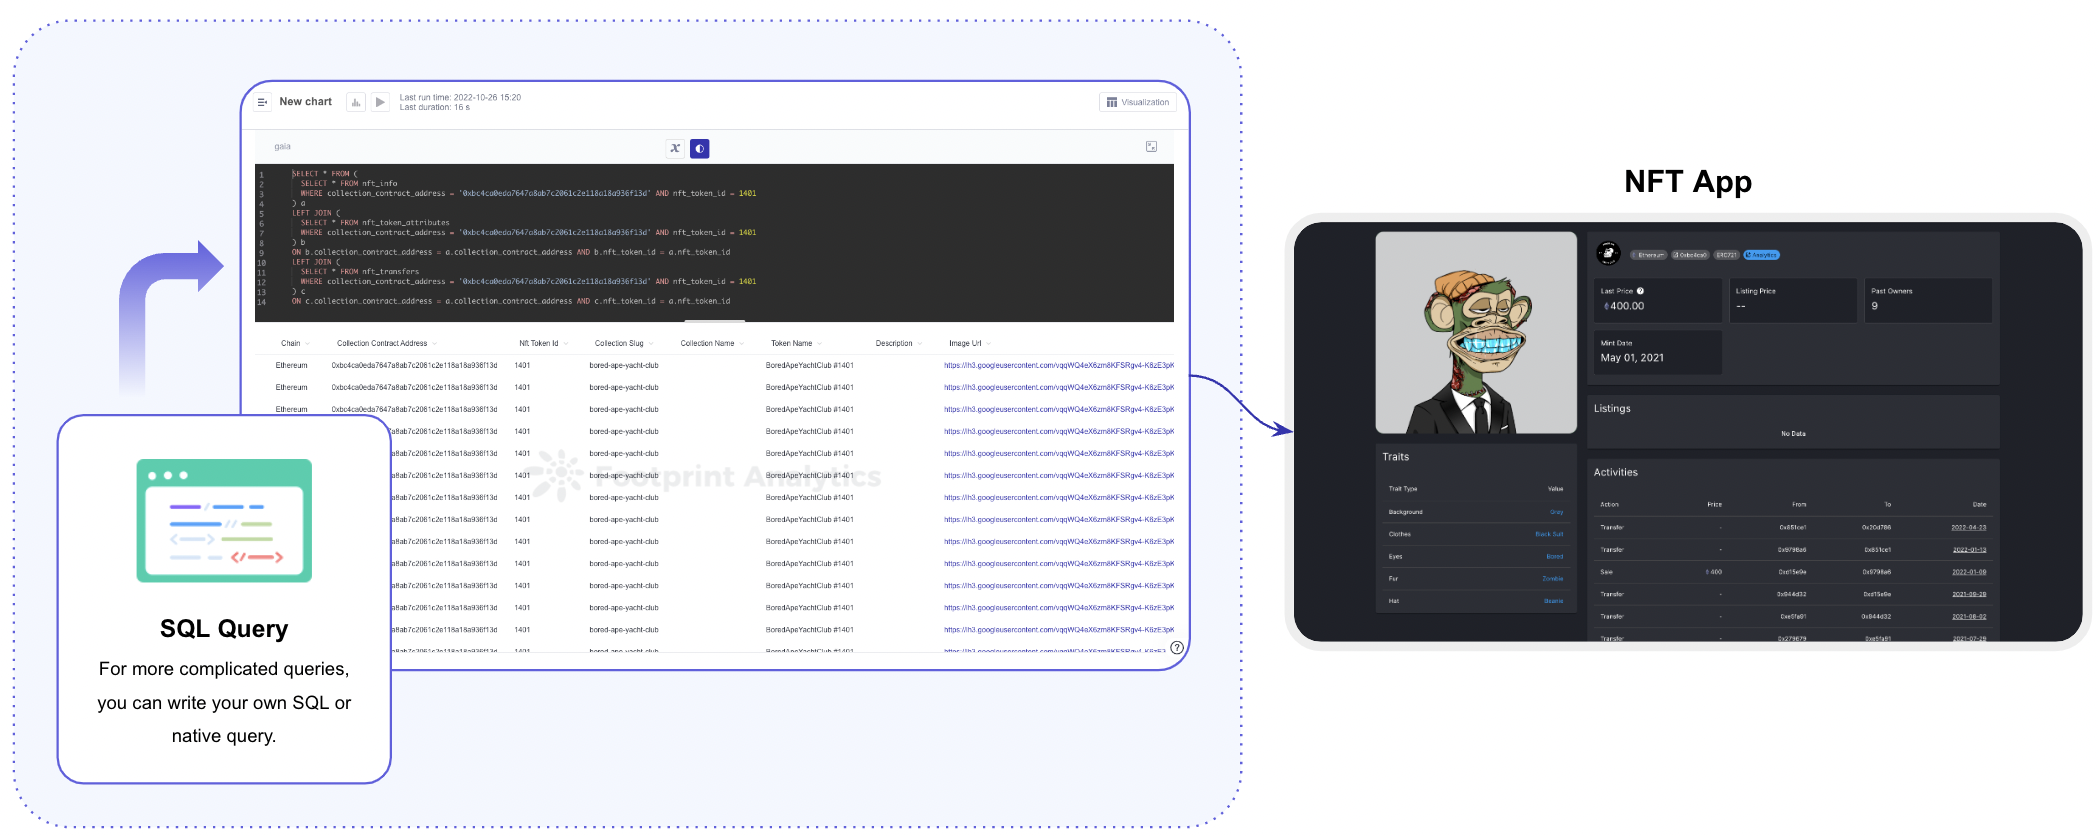
Secondly, Analytics App is a zero-coding analytics platform designed specifically for the crypto industry. With its real-time on-chain data and drag-and-drop interface, you can quickly build charts and dashboards to showcase cutting-edge blockchain market insights without having to write any code. You can even use SQL queries to dive deeper into your data.
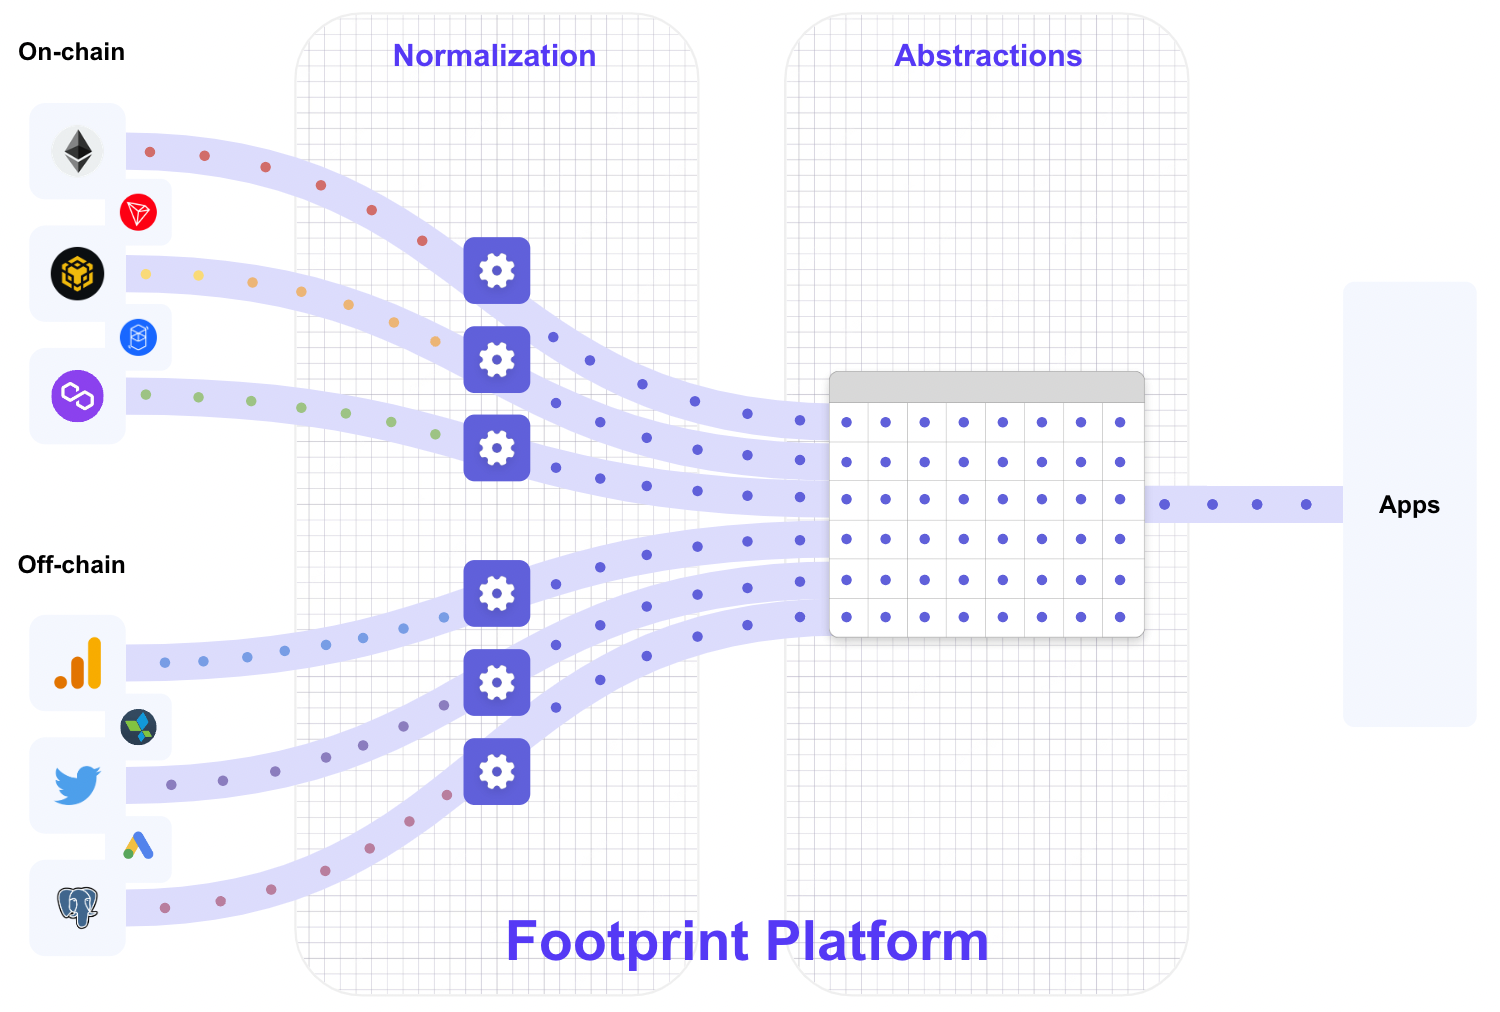
At Footprint, we've developed a model that aggregates this raw data and indexes it to be meaningful. The info about these millions of transactions is broken up by domain—our data engine determines whether it can be classified as GameFi, NFT, DEX, or other. We decode this data so analysts can search for the information they need, like block time, TVL, token price, etc., and immediately display that data on a chart. Instead of strings of numbers and letters that are, to most, indecipherable, you have wallet addresses, chains, NFT collections, and other meaningful categories.

Lastly, Data API is a unified data API for NFTs, GameFi, and DeFi across all major chain ecosystems. It supports both raw data and statistics metrics, allowing you to easily access and utilize the data you need with just one line of code.
Together, these three products form a powerful ecosystem that enables you to make data-driven decisions, gain a competitive advantage, and maximize your marketing strategies. Whether you're a marketer, data analyst, or developer, our ecosystem has something for everyone.
How Footprint Analytics balances flexibility and simplicity
Footprint web application is built on Metabase open source technology. Read more about Metabase:
We use Metabase because it is open—the technology allows users to contribute to the code base, developing and improving it over time.
For example, in the latest update of Metabase the models are introduced. This functionality is allowing users to curate data from another table or tables from the same database to anticipate the kinds of questions people will ask of the data.
Analysts can create charts on the Footprint Analytics platform with a convenient drag-and-drop query builder. This capability significantly lowers the barrier to entry, allowing any user without technical knowledge to use the product and extract business value.
You may find the relevant guides in the following chapter:
It is important to note that, architecturally, Metabase is an abstraction over SQL code; that is, any request made by drag and drop can be represented as SQL. Thus, users who want to build more complex queries or who prefer to work with data using code have the opportunity to use SQL straight away.
Other platforms
Many alternative analytics solutions allow the user to analyze different networks according to various levels of requirements. However, for the most part, alternative solutions tend to go to extremes, implementing either a very flexible product that requires knowledge of query languages or even programming languages a very simple interface with prepared scripts and, accordingly, low flexibility.
Coverage
We have one of the widest coverages in the entire market. We describe the current coverage in detail, referring to the organization of the data (levels, domains), within the following section:
Updated 8 months ago