
Intermediate tables
Problem
Have you ever faced the frustration of running heavy SQL queries on our platform, only to have them crash due to timeouts? Or perhaps you've had to perform complex analytics that involve multiple table measures during query execution? We understand your pain, and we have a solution: intermediary tables.
Solution
In this chapter, we will explain what intermediary tables are, why they are necessary, and how to use them on our platform. To help illustrate their usage, we'll walk through an example.
Suppose you want to determine the percentage of NFT transactions made on the Ethereum network relative to all transactions in the previous month, grouped by day. To accomplish this, you would need to perform the following steps:
- Calculate the number of NFT transactions made on the Ethereum network for each day of the last month.
- Calculate the total number of transactions made on the Ethereum network for each day of the last month.
- Calculate the ratio of NFT transactions to total transactions for each day.
This may seem like a complex process. And this process is complicated not only from the point of view of the request itself, but also from the point of view of the order in which each of the points is executed. The fact is that if you try to execute it with a single request, then the final execution time can turn out to be quite long:

In the figure above, the X-axis shows conditional units, not specific time series, such as seconds
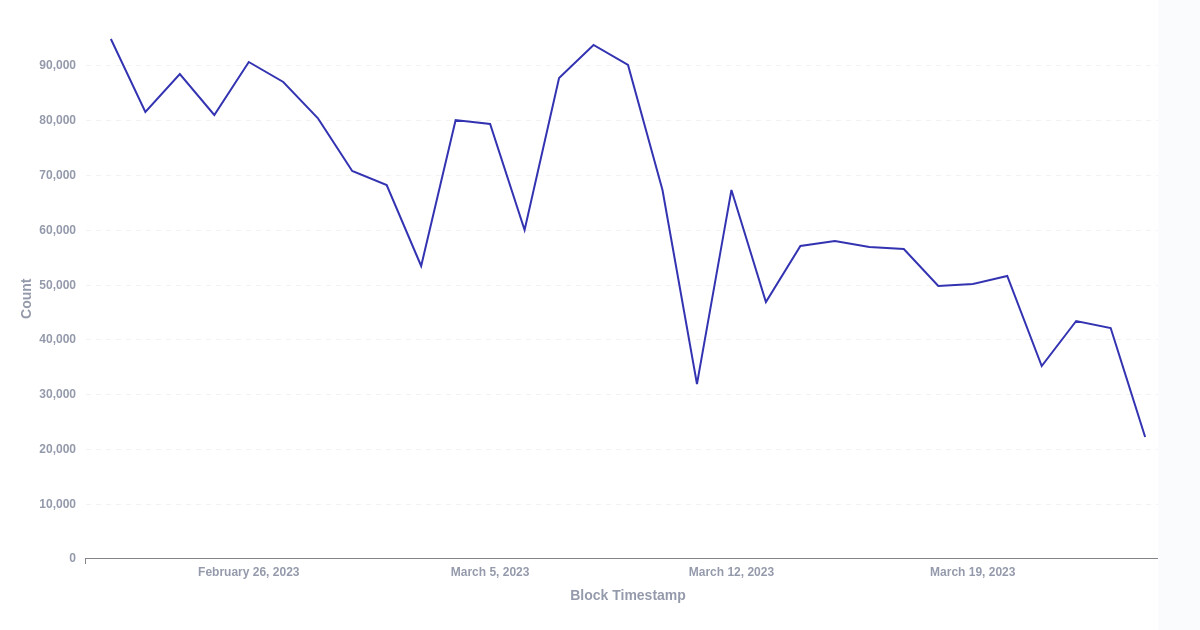
It is evident that executing all three parts sequentially takes a considerable amount of time, measuring 250 in conventional units. In fact, running the complete query for the aforementioned example would take approximately 5 seconds:
A logical optimization presents itself: why not move one or all of the subqueries into separate tables, calculate them once, and then reference the pre-calculated data instead of recalculating it each time? The only remaining task is to ensure that these tables stay current, which can be achieved by scheduling regular updates. In this case, the execution of the same request will look like this:

As a result, the execution time is significantly reduced, as evidenced by our specific example where it was reduced by 3 seconds (you can find a link to the final chart at the end of this document). In the next section, we'll figure out how to do this in our web application.
Guide
Let's assume that we only want to optimize one part of the query above, namely (1) - Calculate the number of NFT transactions made on the Ethereum network for each day of the last month..
Step 1. Switch to no-code mode for creating requests. As a help, you can use our query building guide:
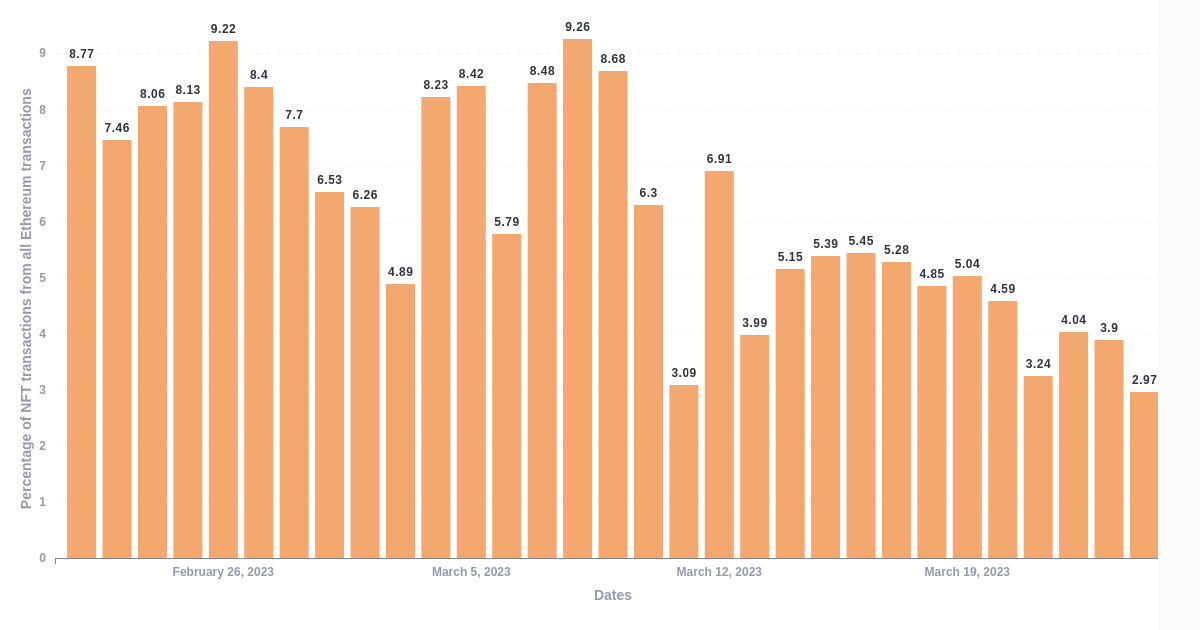
Step 2. Create a chart for (1).

The end result can be the chart shown below:
Step 3. Save the graph as an intermediate table.
Once you have the chart created and saved, you can press the button Save chart as ud table:

Next, you will need to provide a name for the table. It is recommended to choose a descriptive and easily recognizable name, as it will make it simpler to locate the table at a later time. Once you have the name submitted, you will see the following information screen:

On this screen you can access the following information below:
- The name of the table you previously designated.
- The most recent timestamp of the table update.
- Table's SQL. If you are not familiar with this concept, it may be more advanced, but we provide a guide on SQL and its usage on our platform, which can be found at the following link:

After saving the intermediate table, you can begin to query it.
Step 4. Complete the steps (2) and (3).
Construct the following query:

The logic of the chart can be broken down into several steps. First, we query data from the ethereum_transactions table. Then, we filter the results to only include transactions executed within the last 30 days. We then count how many transactions were executed each day. Next, we join this result with the intermediate table we previously saved, using the date as the joining key. This gives us a single table with both the number of Ethereum transactions and the number of Ethereum NFT transactions, grouped by day. To calculate the ratio, we simply divide one by the other. And there you have it - your chart is ready!
To sum up, we have managed to create a complex query without writing any code and greatly improved its execution time by utilizing an intermediate table 🎆
Final thoughts
The intermediate table functionality offers great flexibility in conducting in-depth data analytics. It not only significantly reduces query execution time, but also allows you to build abstractions from multiple interconnected intermediate tables that are regularly updated, as we have already done with some tables:
For instance, you can analyze the number of events emitted by a particular smart contract, group them by day, store the results in a separate table, and compare them with macroeconomic indicators such as all transactions in the network. In essence, the possibilities are limited only by your creativity 👐
Updated 9 months ago